The Mandelbrot set in C++11
Posted on February 28, 2013 by Paul
The code for this post is on GitHub: https://github.com/sol-prog/Mandelbrot_Set.
Yet another how to draw the Mandelbrot set article ? Well, yes and no, on the one hand fractals are fun and on the other hand, it could be instructive to play with complex numbers and lambdas in C++11. Also, the article presents a not so common continuous coloring procedure based on a slight modification of the Bernstein polynomials.
Please note, that calculating the Mandelbrot set can be done more efficiently if one uses the GPU (using OpenGL shaders for example) and not the CPU.
Let’s start by creating a small class that will let us define the domain in which we search for points from the Mandelbrot set:
 1 template <typename T>
 2 class window {
 3 	T _x_min, _x_max, _y_min, _y_max;
 4
 5 public:
 6 	window(T x_min, T x_max, T y_min, T y_max)
 7 	: _x_min(x_min), _x_max(x_max), _y_min(y_min), _y_max(y_max)
 8 	{}
 9
10 // Utility functions for getting the size, width and height of the window
11 	T size() {
12 		return (width() * height());
13 	}
14
15 	T width() {
16 		return (_x_max - _x_min);
17 	}
18
19 	T height() {
20 		return (_y_max - _y_min);
21 	}
22
23 // Getters and setters for the window elements
24 	...
25
26 // Reset all values
27 	void reset(T x_min, T x_max, T y_min, T y_max) {
28 		....
29 	}
30 };
we could also use the above class to store the bounds of an image, or the bounds of a window on our computer screen.
The Mandelbrot set is defined by the complex polynomial:
$$ z \mapsto {z^2} + c $$
where \(c \in \mathbb{C}\) is a parameter.
We can implement this in C++11 as a lambda:
1 auto func = [] (std::complex <double> z, std::complex<double> c) -> std::complex<double> {return z * z + c; };that could be easily passed, as a parameter, to other functions.
In order to obtain a nice picture, we are going to map the continuous domain in which we search for points from the Mandelbrot set to a discrete domain that represents pixel coordinates:
 1 void mandelbrot() {
 2 	// Define the size of the image
 3 	window<int> scr(0, 1200, 0, 1200);
 4 	// The domain in which we test for points
 5 	window<double> fract(-2.2, 1.2, -1.7, 1.7);
 6
 7 	// The function used to calculate the fractal
 8 	auto func = [] (std::complex <double> z, std::complex<double> c) -> std::complex<double> {return z * z + c; };
 9
10 	....
11
12 	// Loop over all pixels from scr and check if every pixel is in the Mandelbrot set
13 	fractal( ... );
14 }
For simplicity, we will use the escape time algorithm. Basically, for every pixel, we iterate over the formula \({z_{n + 1}} = {z_n}^2 + c\) until \(\mid {z_n} \mid \gt 2\) or a maximum number of iterations is reached. We’ll use the iteration numbers to assign a particular color to every pixel. These are the functions called by mandelbrot():
 1 void fractal(window<int> &scr, window<double> &fract, int iter_max, std::vector<int> &colors,
 2 	const std::function<std::complex<double>(std::complex<double>, std::complex<double>)> &func,
 3 	const char *fname, bool smooth_color) {
 4
 5 	get_number_iterations(scr, fract, iter_max, colors, func);
 6
 7 	// Save (show) the result as an image
 8 	plot(scr, colors, iter_max, fname, smooth_color);
 9 }
10
11 // Loop over each pixel from our image and check if the point associated with this pixel escapes to infinity
12 void get_number_iterations(window<int> &scr, window<double> &fract, int iter_max, std::vector<int> &colors,
13 	const std::function<std::complex<double>(std::complex<double>, std::complex<double>)> &func) {
14 	int k = 0;
15 	for(int i = scr.y_min(); i < scr.y_max(); ++i) {
16 		for(int j = scr.x_min(); j < scr.x_max(); ++j) {
17 			std::complex<double> c((double)j, (double)i);
18 			c = scale(scr, fract, c);
19 			colors[k] = escape(c, iter_max, func);
20 			k++;
21 		}
22 	}
23 }
24
25 // Convert a pixel coordinate to the complex domain
26 std::complex<double> scale(window<int> &scr, window<double> &fr, std::complex<double> c) {
27 	std::complex<double> aux(c.real() / (double)scr.width() * fr.width() + fr.x_min(),
28 		c.imag() / (double)scr.height() * fr.height() + fr.y_min());
29 	return aux;
30 }
31
32 // Check if a point is in the set or escapes to infinity, return the number if iterations
33 int escape(std::complex<double> c, int iter_max, const std::function<std::complex<double>(std::complex<double>,
34 	std::complex<double>)> &func) {
35 	std::complex<double> z(0);
36 	int iter = 0;
37
38 	while (abs(z) < 2.0 && iter < iter_max) {
39 		z = func(z, c);
40 		iter++;
41 	}
42
43 	return iter;
44 }
The question that remains to be solved is how to assign colors to a point from the Mandelbrot set. My first attempt was to use a linear map between the number of iterations and the number of possible values for an RGB image. We start by dividing the number of iterations corresponding to a particular pixel to the maximum number of iterations, this will gives us a number t on the unit interval. An RGB image can have \(256^3\) colors, so we multiply t with \(256^3\), cast the value to an integer that is used as an index in an array of colors. Obviously, we are not going to generate and store \(256^3\) colors, that will be silly. If we imagine our virtual array of colors as a 3D array, we can get the r, g, b indices with the following function:
 1 std::tuple<int, int, int> get_rgb_piecewise_linear(int n, int iter_max) {
 2 	int N = 256; // colors per element
 3 	int N3 = N * N * N;
 4 	// map n on the 0..1 interval (real numbers)
 5 	double t = (double)n/(double)iter_max;
 6 	// expand n on the 0 .. 256^3 interval (integers)
 7 	n = (int)(t * (double) N3);
 8
 9 	int b = n/(N * N);
10 	int nn = n - b * N * N;
11 	int r = nn/N;
12 	int g = nn - r * N;
13 	return std::tuple<int, int, int>(r, g, b);
14 }
An alternative to the above approach, with similar results, will be to cast the value of t multiplied with \(256^3\) to an unsigned 32 bits integer (4 bytes). Since the r, g, b numbers are 1 byte each, we can read their values from the 32 bits unsigned integer previously calculated.
The resulting image was saved on the disk with the FreeImage library, you can see the complete code, save_image.cpp, on the Github repository for this article.
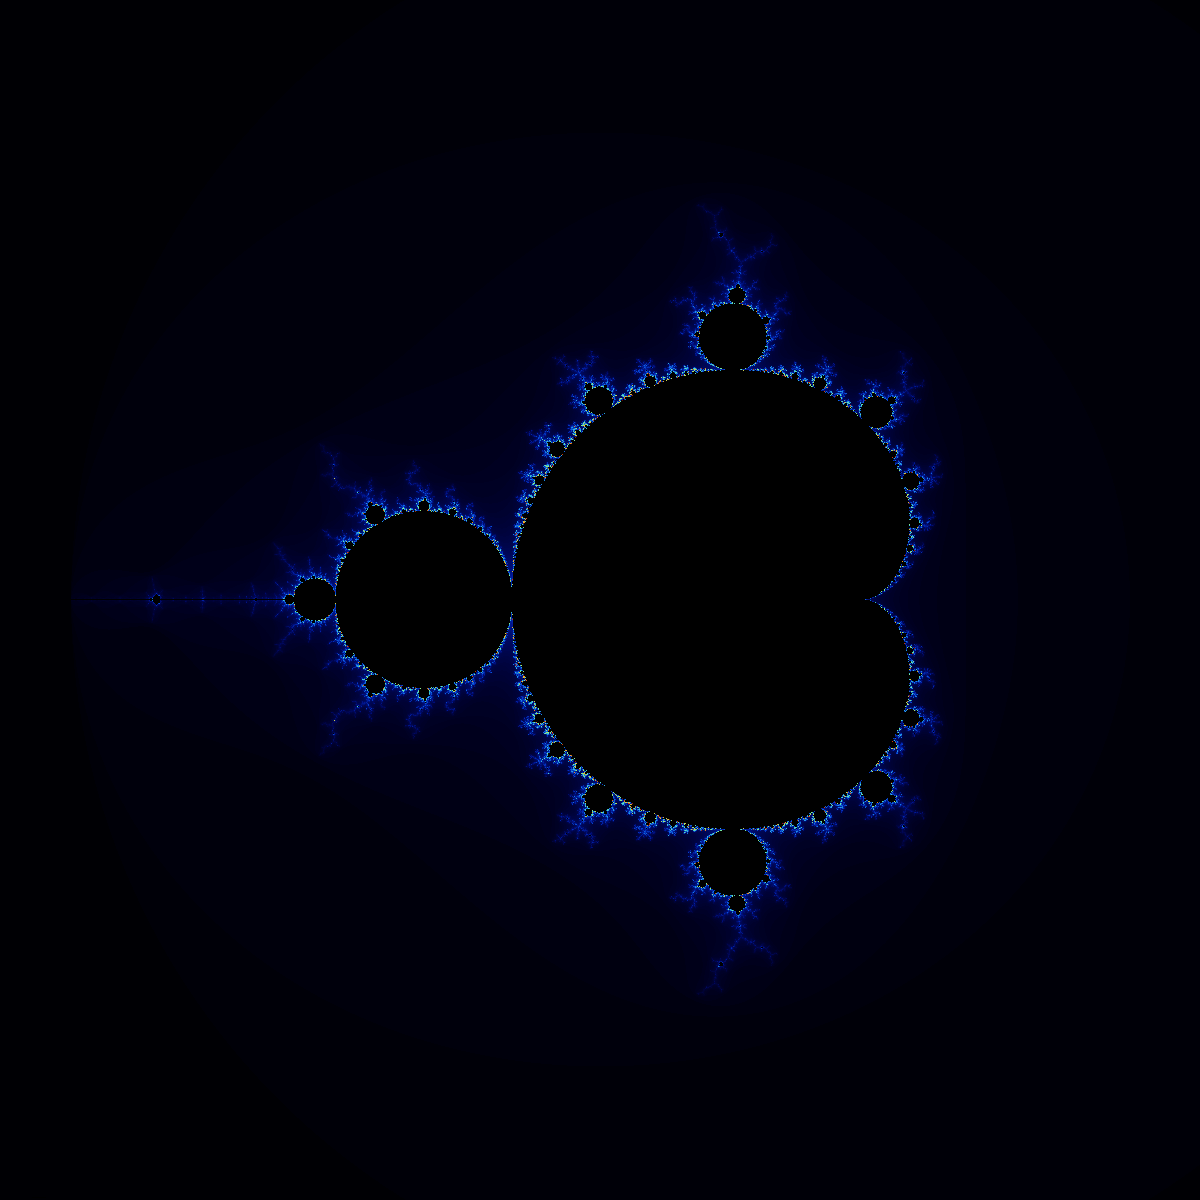
The map between the iteration number and the 3D color space was made using three piecewise linear functions, the discontinuous nature of this map will be reflected in the resulting image band effect:
If we zoom close enough to one of the bulbs of the set, we’ll have an even nicer image, unfortunately still banded:
There are various tricks with which we can obtain a more continuous image, one of them, suggested in the cited Wikipedia article is the Normalized Iteration Count algorithm. The problem with this algorithm is that it needs modifications for different, but related, fractals like the Julia set.
The key to a nice image, without color bands, is the word continuous! I mean, how do we expect to obtain a smooth transition from color to color if we use a discontinuous map between the iteration count and the 3D color space ?
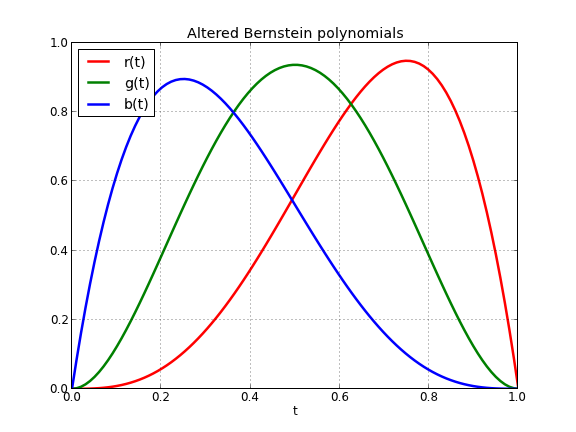
Well, the solution is not that complicated - use three smooth, continuous functions that will map every number t. Remember that t was obtained by dividing the number of iterations for every point in the set with the maximum number of iterations, on the unit interval. We could use any smooth polynomial that is defined on the unit interval and has values on the same interval. A slightly modified form of the Bernstein polynomials looks like the perfect match for what we need, they are continuous, smooth and have values in the [0, 1) interval:
\[r(t) = 9 \cdot \left( {1 - t} \right) \cdot {t^3}\] \[g(t) = 15 \cdot {\left( {1 - t} \right)^2} \cdot {t^2}\] \[b(t) = 8.5 \cdot {\left( {1 - t} \right)^3} \cdot t\]We can plot the above functions in order to see how smooth they are:
Implementing the above functions in C++ is straightforward:
1 std::tuple<int, int, int> get_rgb_smooth(int n, int iter_max) {
2 // map n on the 0..1 interval
3 double t = (double)n/(double)iter_max;
4
5 // Use smooth polynomials for r, g, b
6 int r = (int)(9*(1-t)*t*t*t*255);
7 int g = (int)(15*(1-t)*(1-t)*t*t*255);
8 int b = (int)(8.5*(1-t)*(1-t)*(1-t)*t*255);
9 return std::tuple<int, int, int>(r, g, b);
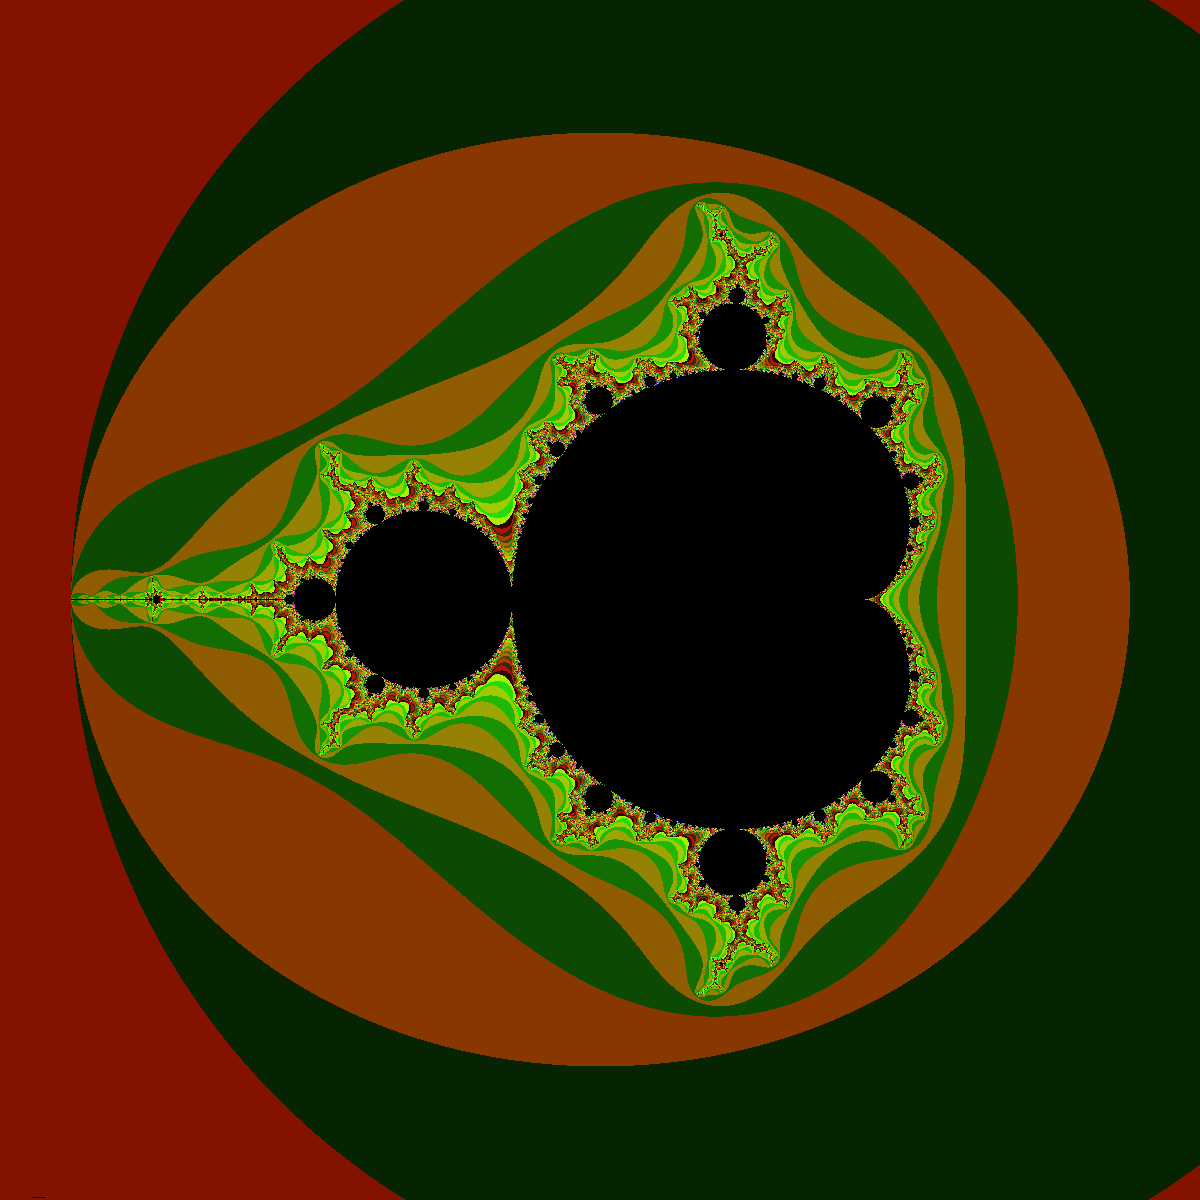
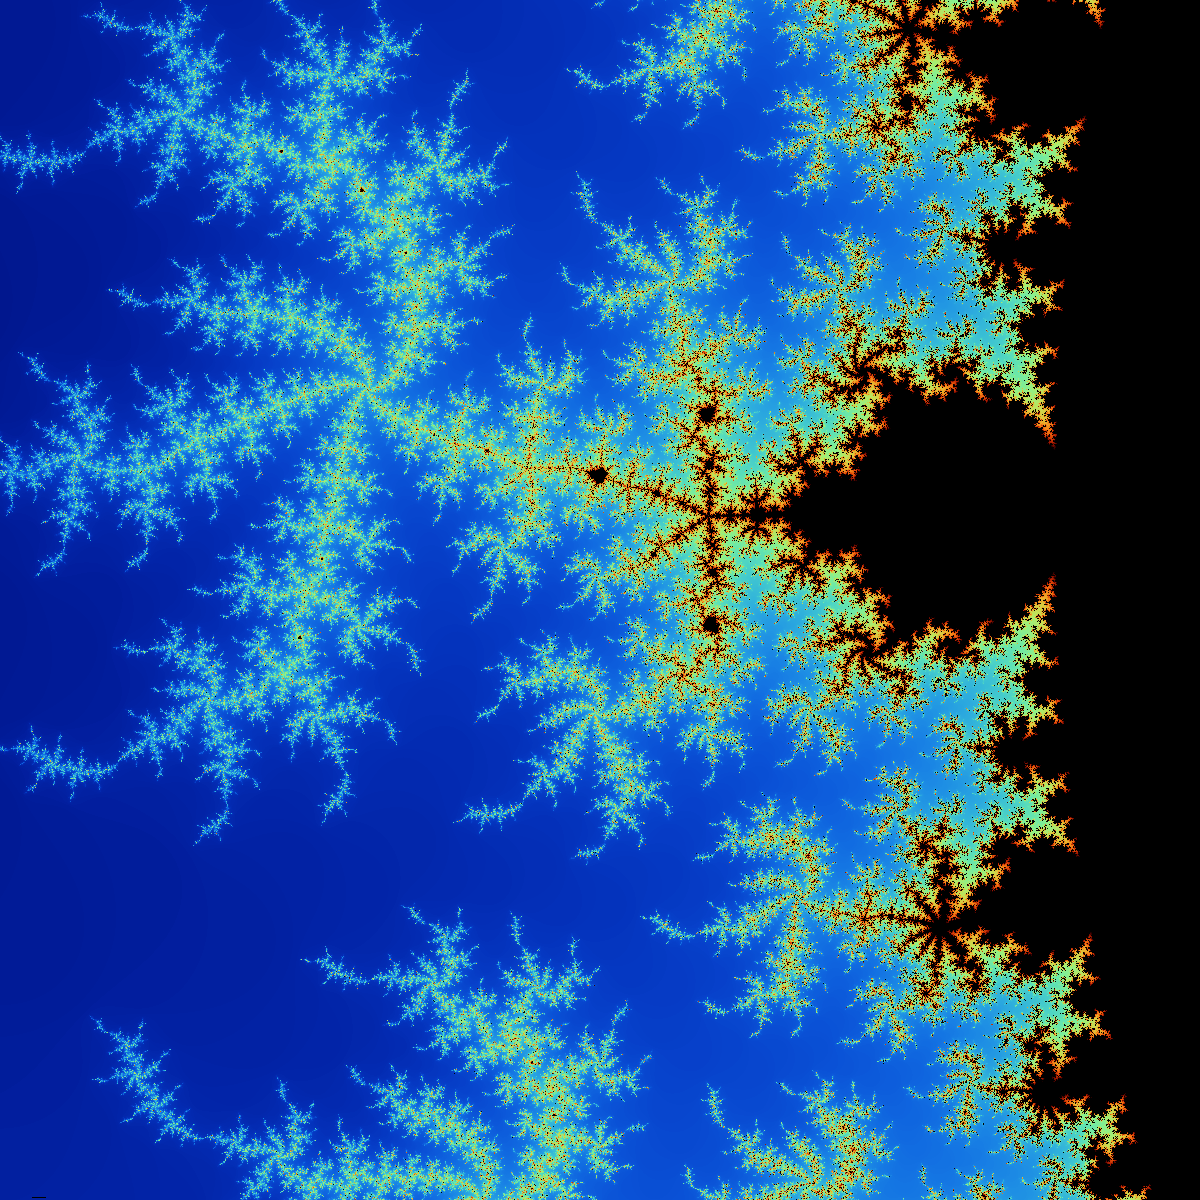
10 }Let’s see now, the effect of using a smooth map from the iteration numbers to the 3D RGB space:
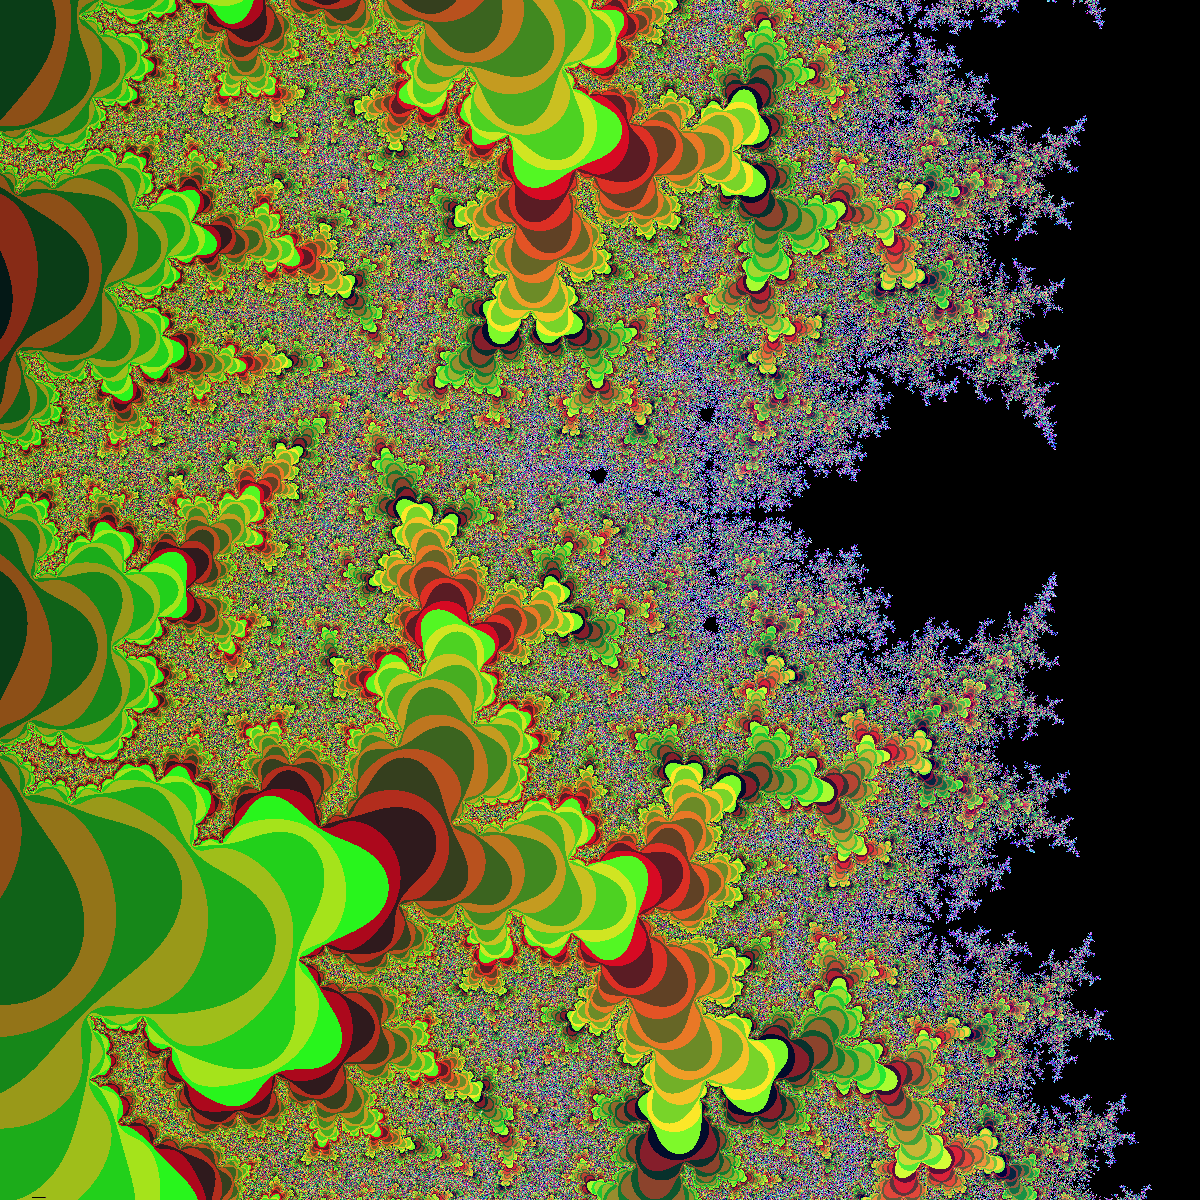
If we zoom again close enough to one of the bulbs of the set, we’ll have an even nicer image, this time without any band effect:
Suppose now that you’ve had enough fun with the classical Mandelbrot set and you want to try something new, like the third order Mandelbrot set :). How can you add this to the above code ? We’ll need to define a new driver function, say triple_mandelbroot:
1 void triple_mandelbrot() {
2 // Define the size of the image
3 window<int> scr(0, 1200, 0, 1200);
4 // The domain in which we test for points
5 window<double> fract(-1.5, 1.5, -1.5, 1.5);
6
7 // The function used to calculate the fractal
8 auto func = [] (std::complex <double> z, std::complex<double> c) -> std::complex<double> {return z * z * z + c; };
9
10 int iter_max = 500;
11 const char *fname = "triple_mandelbrot.png";
12 bool smooth_color = true;
13 std::vector<int> colors(scr.size());
14
15 fractal(scr, fract, iter_max, colors, func, fname, smooth_color);
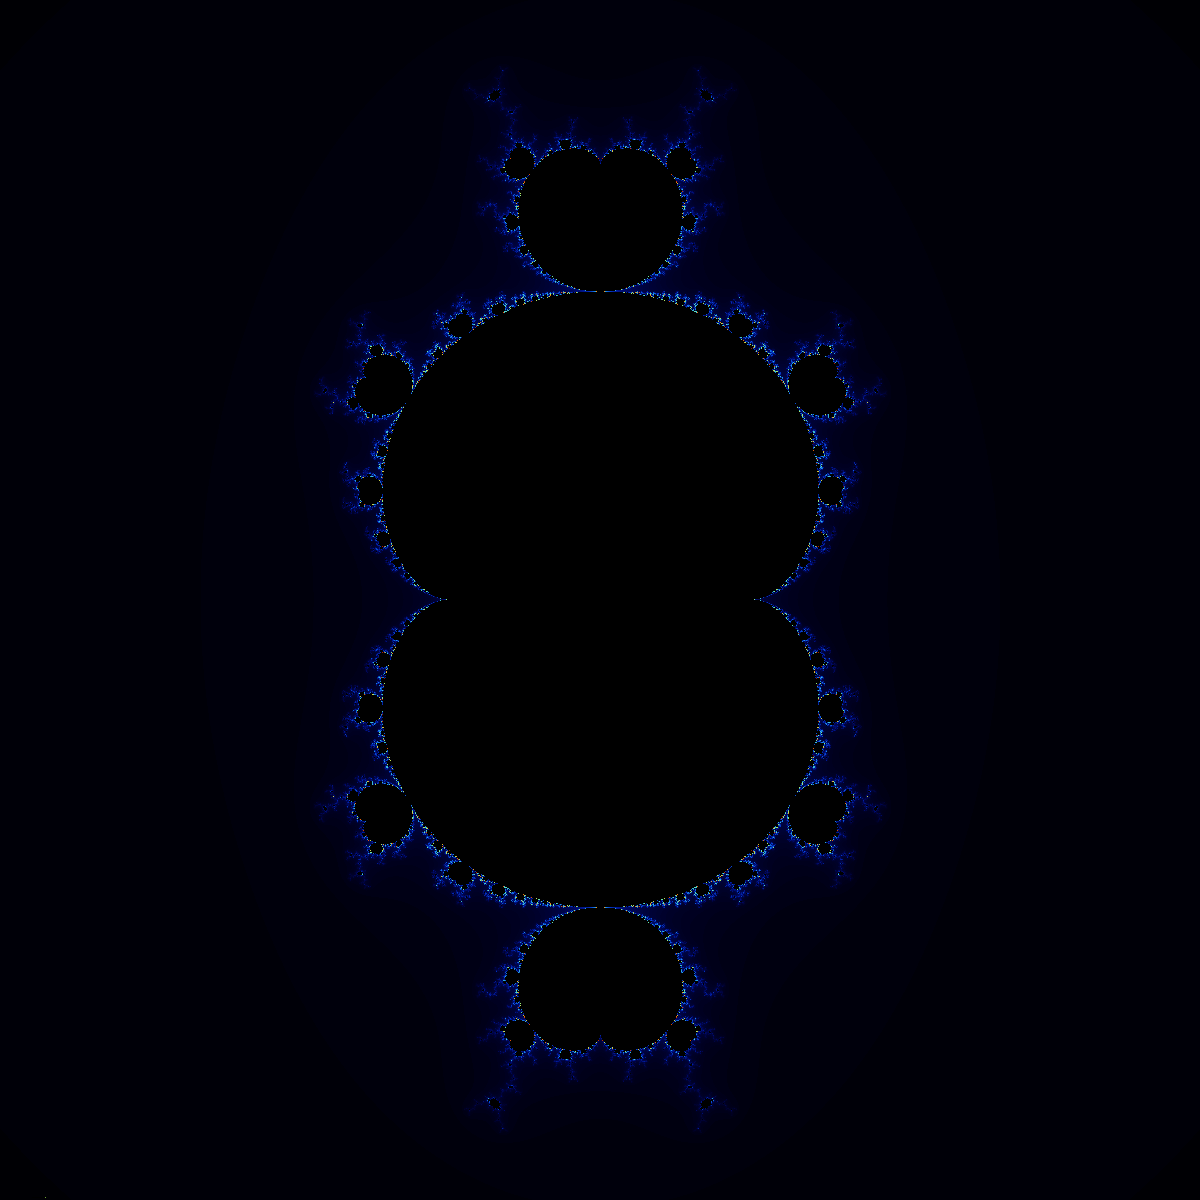
16 }Let’s see how it looks:
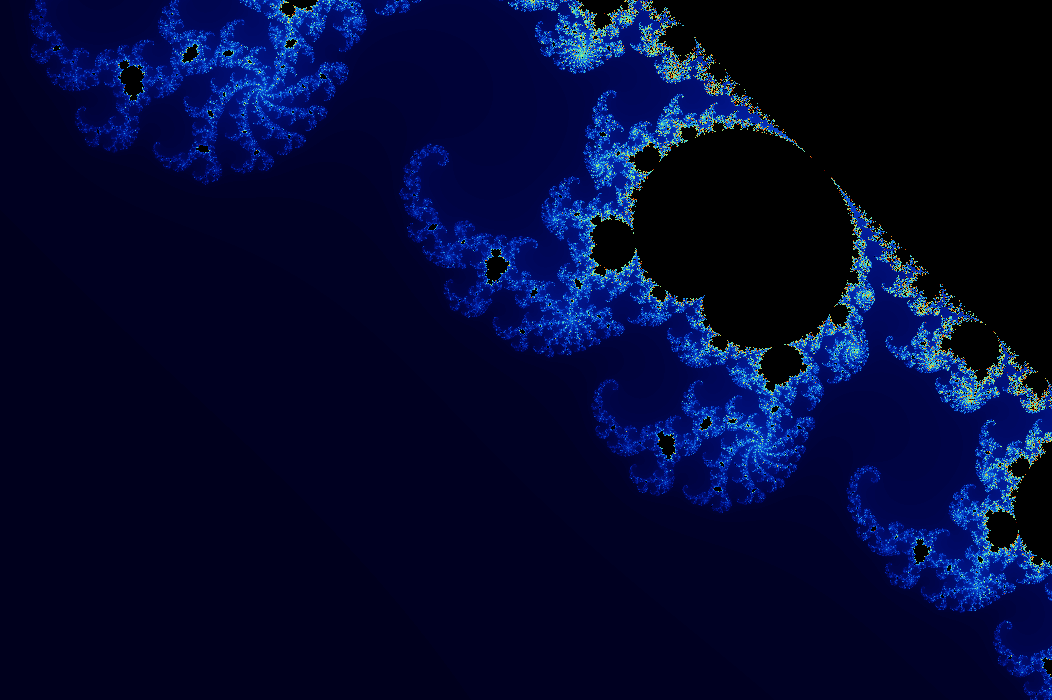
after a zoom:
If you are interested in learning more about the C++11 Standard Library, I would recommend reading The C++ Standard Library: A Tutorial and Reference (2nd Edition) by N. M. Josuttis:

or Professional C++ by M. Gregoire, N. A. Solter, S. J. Kleper 2nd edition: