Install NumPy, SciPy, Matplotlib with Python 3 on Windows
Posted on February 25, 2017 by Paul
Updated 26 January 2020
This is a short tutorial about installing Python 3 with NumPy, SciPy and Matplotlib on Windows.
There is also a video version of this tutorial:
We’ll start by installing the latest stable version of Python 3, which at the time of this writing is 3.8. Head over to https://www.python.org/downloads/ and download the installer. The default Python Windows installer is 32 bits and this is what I will use in this article. If you need the 64 bits version of Python, check the Looking for a specific release? section from the above page.
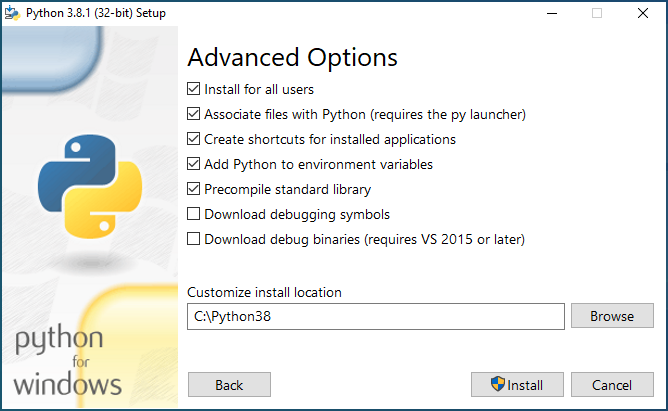
Start the installer and select Customize installation. On the next screen leave all the optional features checked. Finally, on the Advanced Options screen make sure to check Install for all users, Add Python to environment variables and Precompile standard library. Optionally, you can customize the install location. I’ve used C:\Python38. You should see something like this:
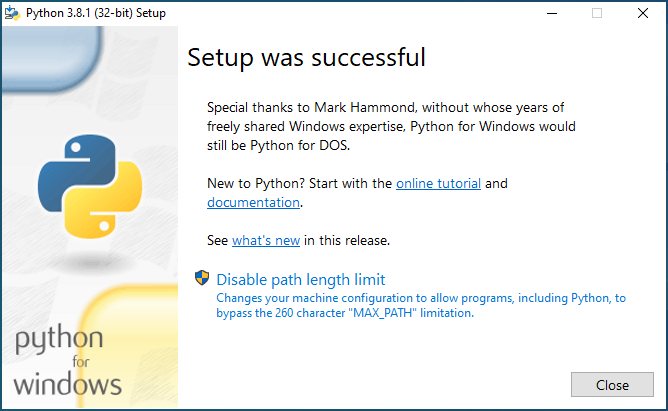
Press the Install button and in a few minutes, depending on the speed of your computer, you should be ready. On the last page of the installer, you should also press the Disable path length limit:
Now, to check if Python was correctly installed, open a Command Prompt (or a PowerShell) window. Press and hold the SHIFT key and right click with your mouse somewhere on your desktop, select Open command window here. Alternatively, on Windows 10, use the bottom left search box to search for cmd.
Write python in the command window and press Enter, you should see something like this:
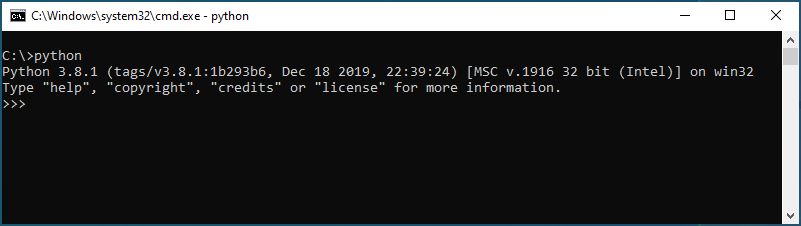
Exit from the Python interpreter by writing quit() and pressing the Enter key.
Now, open a cmd window like before. Use the next set of commands to install NumPy, SciPy and Matplotlib:
1     python -m pip install numpy
2     python -m pip install scipy
3     python -m pip install matplotlib
After each of the above commands you should see Successfully installed ….
Launch Python from a cmd window and check the version of Scipy, you should see something like this:
1 C:\>python
2 Python 3.8.1 (tags/v3.8.1:1b293b6, Dec 18 2019, 22:39:24) [MSC v.1916 32 bit (Intel)] on win32
3 Type "help", "copyright", "credits" or "license" for more information.
4 >>> import scipy as sp
5 >>> sp.version.version
6 '1.4.1'
7 >>>
Let’s try something a bit more interesting now, let’s plot a simple function with Matplotlib. First, we’ll import SciPy and Matplotlib with:
1 import scipy as sp
2 import matplotlib.pylab as plt
Next, we can define some points on the (0, 1) interval with:
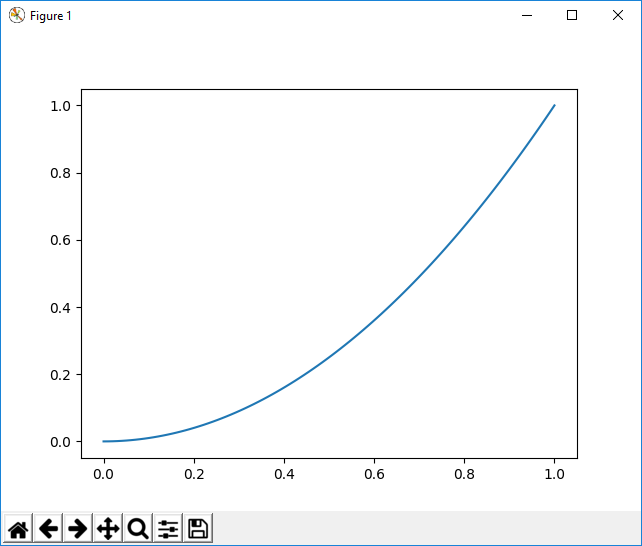
1 t = sp.linspace(0, 1, 100)Now, let’s plot a parabola defined by the above interval:
1 plt.plot(t, t**2)
2 plt.show()
You should see something like this:
If you want to learn more about Python and Matplotlib, I recommend reading Python Crash Course by Eric Matthes. The book is intended for beginners, but has a nice Data Visualization intro to Matplotlib chapter:
Another good Python book, for more advanced users, which also uses Matplotlib for some of the book projects is Python Playground by Mahesh Venkitachalam: